How Defenses Controlled Expected Threat During Counter Attacks at the Euro
Recovery runs and responsive outside backs were key features
European teams have trended towards having high defensive lines in the last two major tournaments.
At the 2019 World Cup, the average defensive line was 49.8 yards from a team’s goal. European teams’ average defensive line was 52.9 yards at the World Cup. The average defensive line was 51.2 yards at the 2022 Euro.
As more teams position their defense higher up the field, I wanted to know how they deal with counter attacks.
This post will look at how defenses at the Euro controlled for Expected Threat (xT) and Expected Goals (xG) on counter attacks.
A Look at the Numbers
Using Statsbomb’s available data from the Euro, I was able to find how many counter attacks defenses faced on a per 90-minute basis.
Calculating the xT and the xG from the Euro allowed me to see which teams did the best at controlling these metrics per counter attack faced.
Norway’s position is misleading because these numbers don’t account for bad individual defending. It only considers the positioning of each individual defender and attacker.
After combining the data with the video, I saw two areas where defenses can improve their controlled xT on counter attacks: the responsiveness of outside backs and recovery runs from defenders that change the trajectory of dribbling runs from attacking players.
Responsiveness of Outside Backs
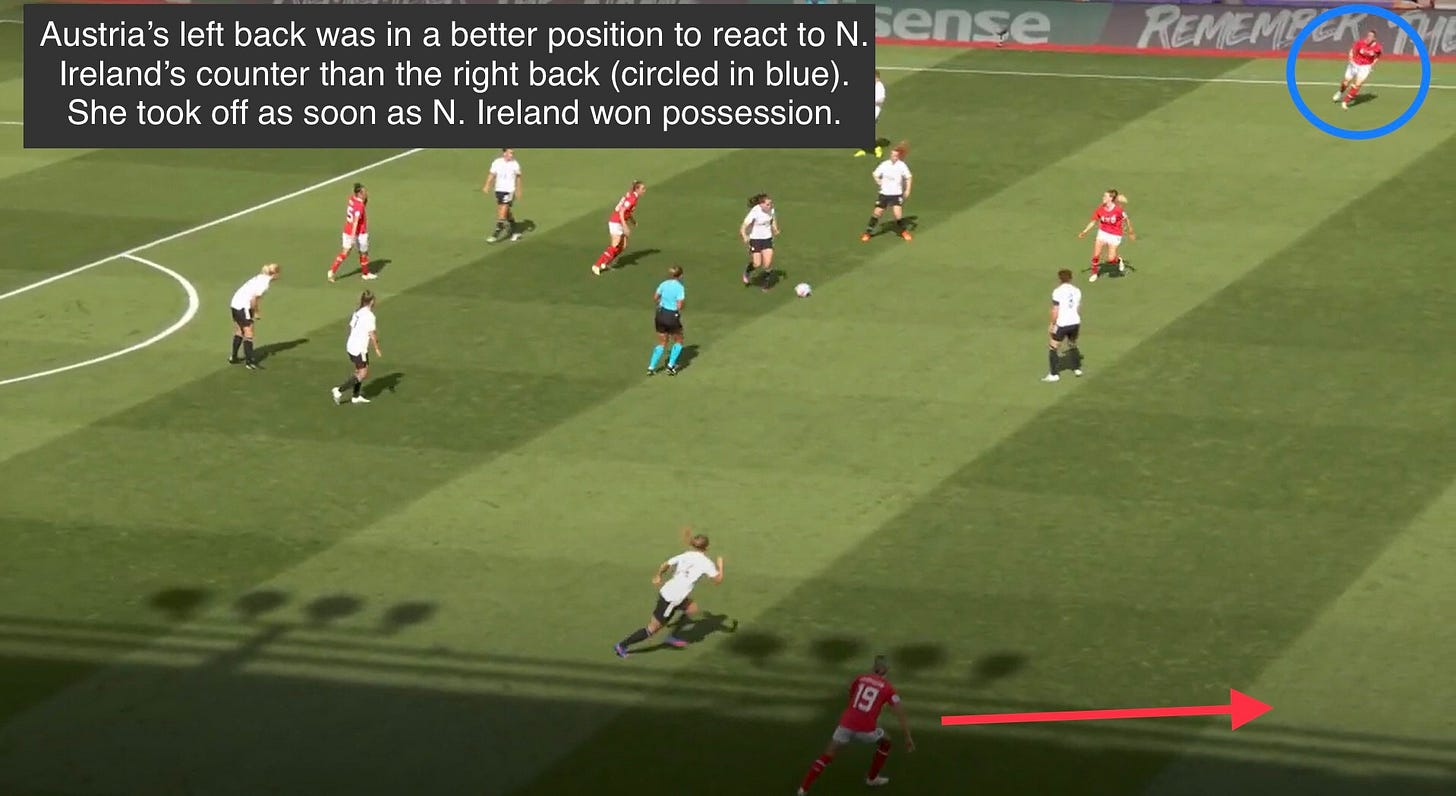
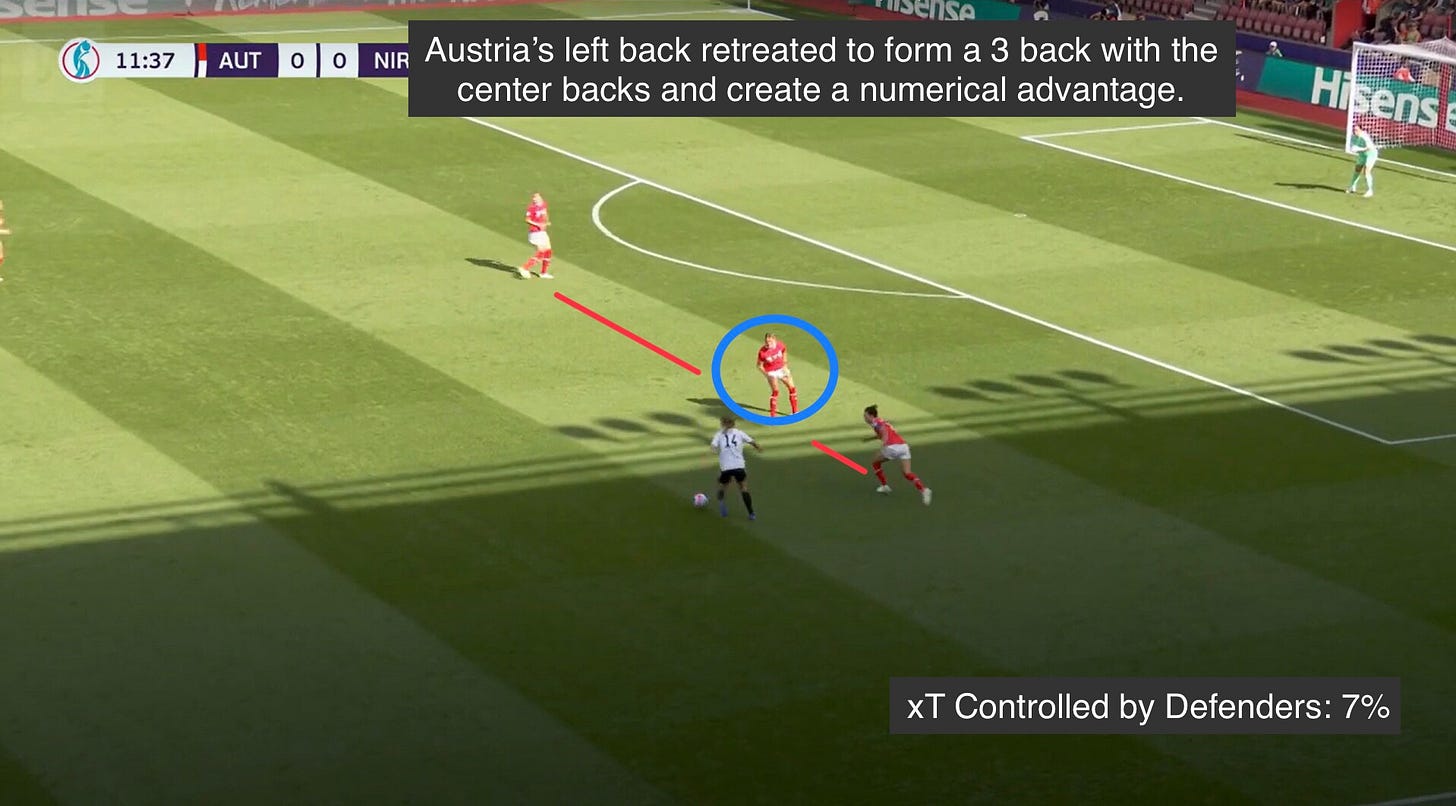
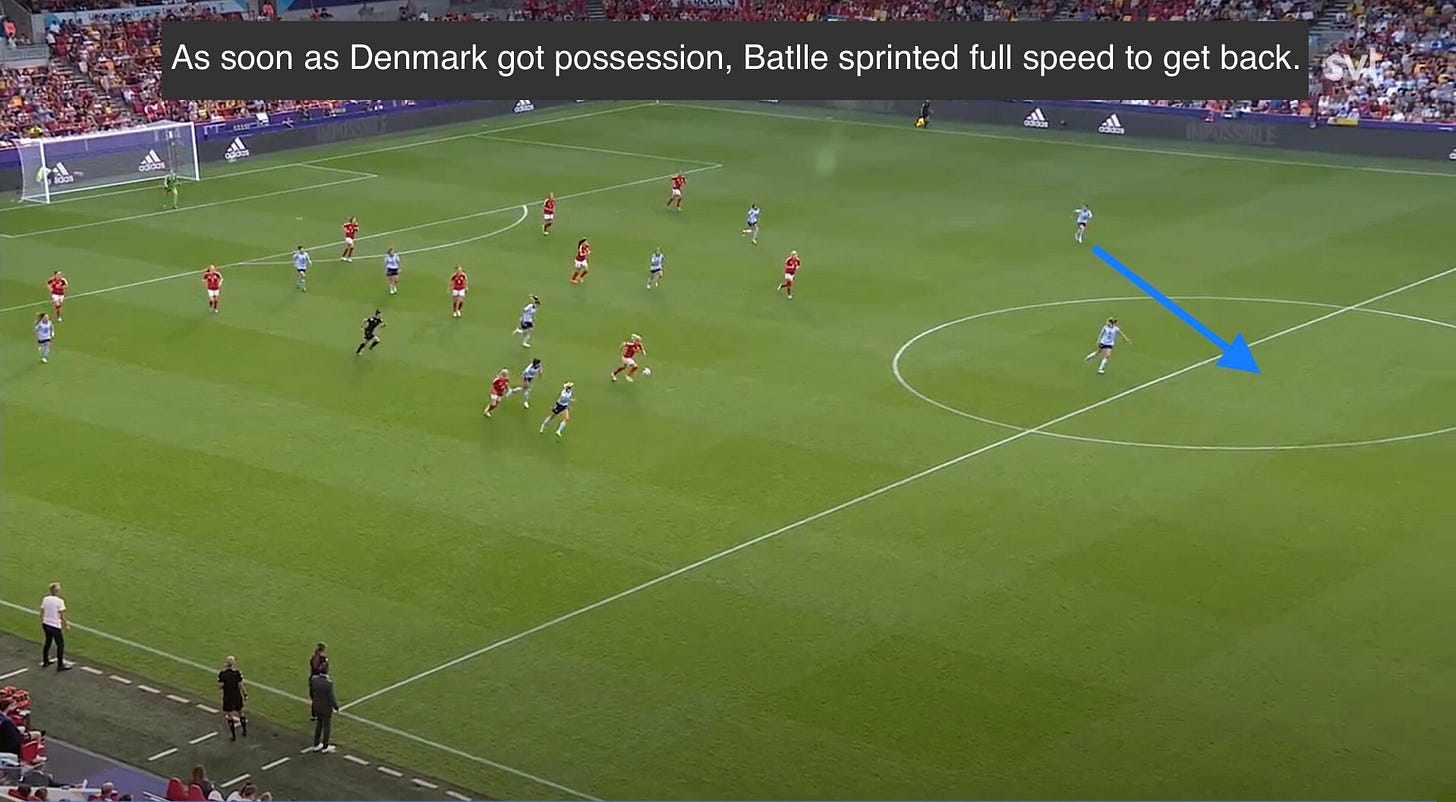
At the Euro, outside backs that were quick to respond to counter attacking sequences often put their teams in a more favorable position on the field (numerical advantage) and in the data (better control of xT).
Below are examples of outside backs reacting quickly to lost possession to form a 3 back with the center backs.
Austria Left Back Verena Hanshaw:
Spain Right Back Ona Batlle:
England Right Back Lucy Bronze:
Recovery Runs & Center Back Positioning
Getting attacking players on the dribble to take their touches outside the goal frame is important. It is harder to score goals from shots taken outside the frame of the goal.
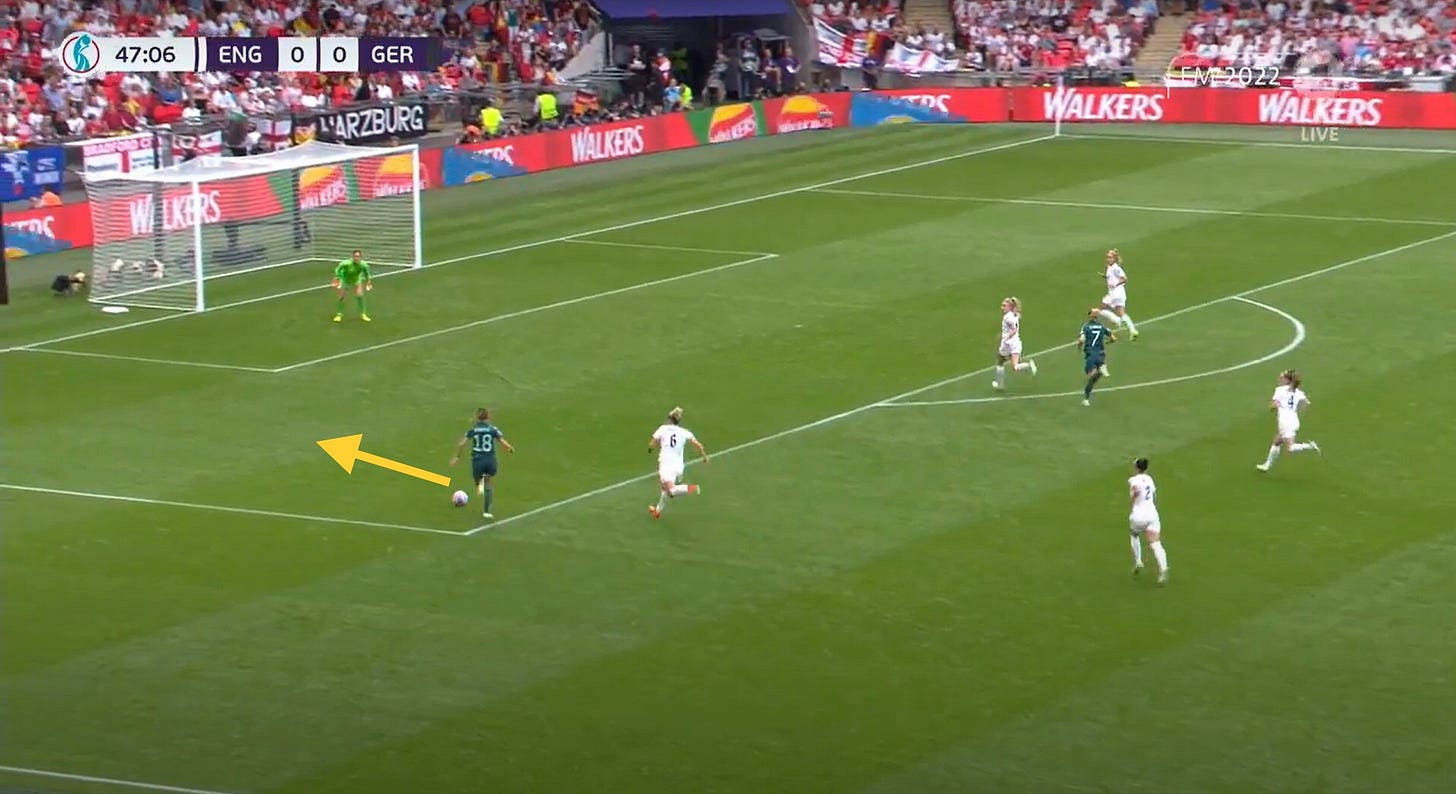
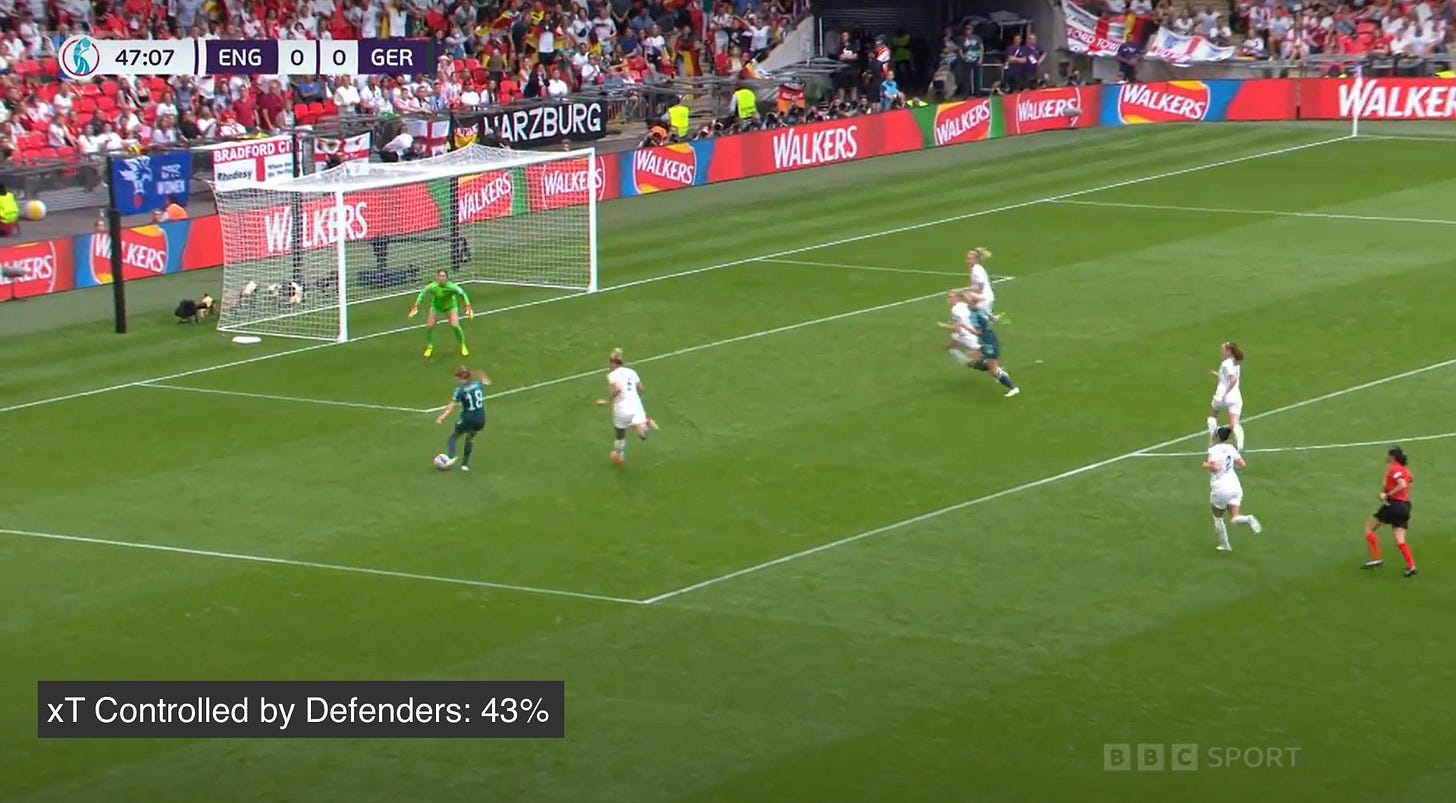
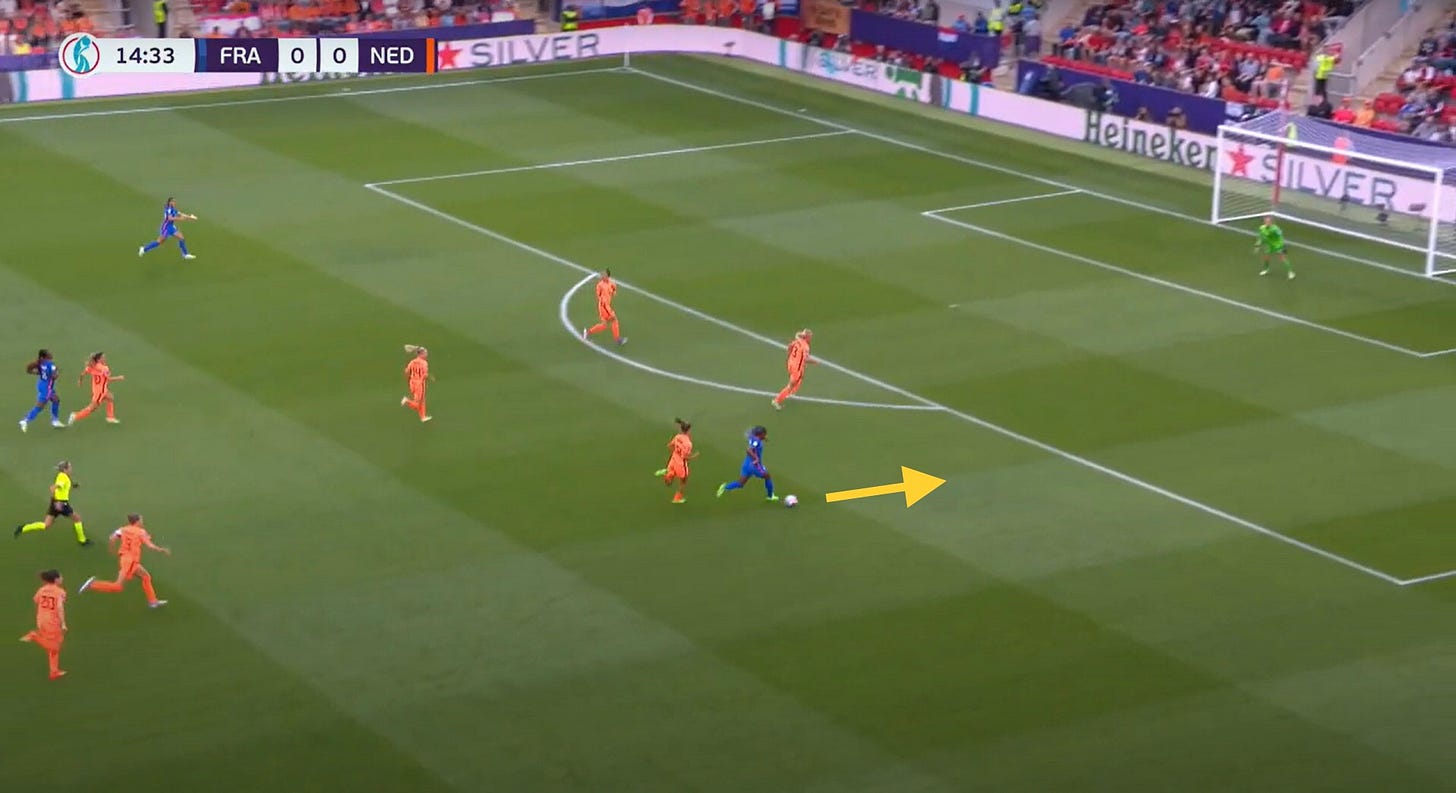
Recovery runs from defenders affect the trajectory of the dribbling run. Even though the defender is behind the attacker, the attacker can sense the defender’s presence. This affects direction of the following touches in the dribbling run.
Defenses had even more success with this when there was a centrally located center back helping to guide the attacker out of dangerous zones.
England recovery run against Germany:
Netherlands recovery run against France:
Switzerland recovery run against Netherlands:
Conclusion
Controlling expected threat is a very interesting metric that I think could be useful for analyzing both individual defenders as well as the defense as a unit.
The goal of this post was to look at the performances of defenses on counter attacks and give actionable insight as to how it can be done.
Photo: Matteo Ciambelli/DeFodi Images


